The trends block on the dashboard allows you to easily compare your budgeting across the past five weeks of rostering. This feature is especially useful for tracking hours worked, average pay rates, and estimated labour costs over time. Each metric helps managers gain insights into their roster spending, offering a clear picture of workforce costs and aiding in budget adjustments. With this guide, you’ll learn how to interpret each view and apply the data to enhance your rostering efficiency.
1. Adding widgets to the dashboard
To add the roster trends widgets to your dashboard, follow these steps:
1.1 Click the + Widget Button: On your Dashboard, locate and click the + Widget button in the top right corner of the screen.
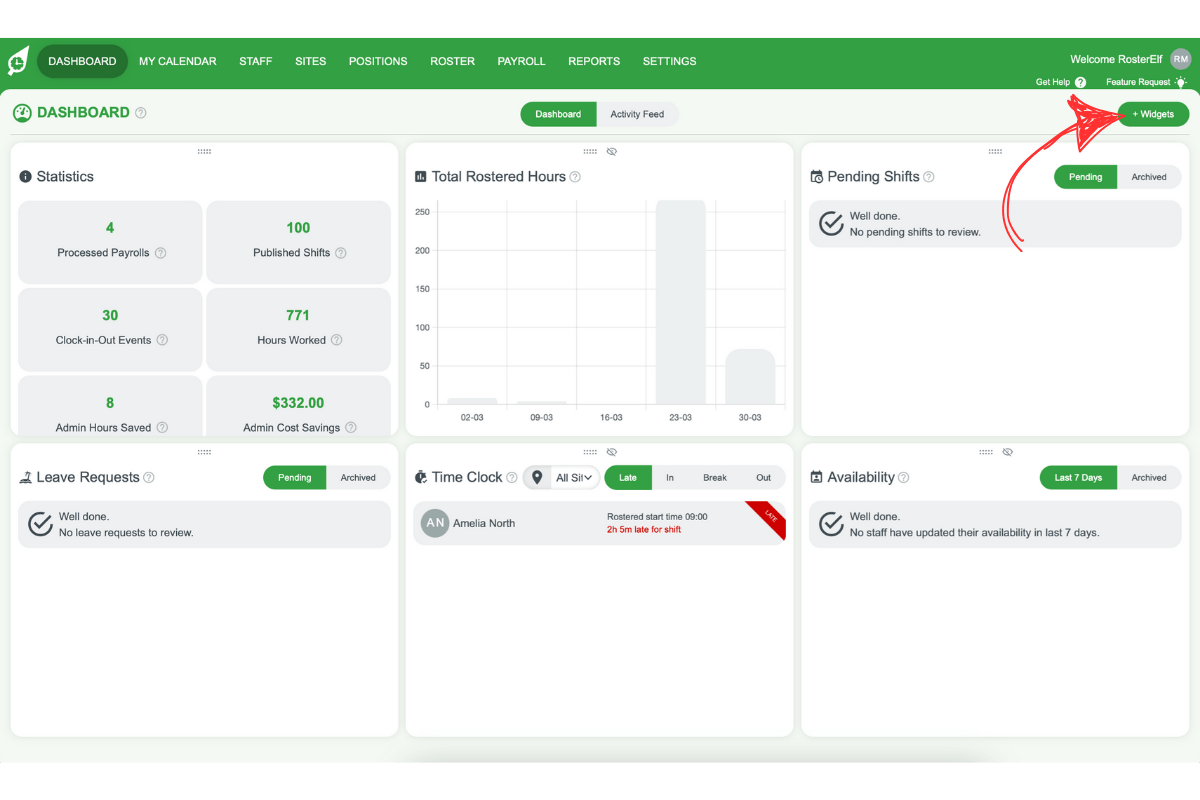
1.2 Select the Desired Widgets: In the pop-up menu, select each of the following widgets to view different budget insights:
- Roster (Hours) to view hours worked.
- Roster (Labour Cost) for labour cost estimates.
- Roster (Avg Pay Rate) for average pay rate insights.

1.3 Finalise Your Selection: After selecting the widgets, close the pop-up menu by clicking on the X icon on the top right, and they will appear on your dashboard, ready for use.
2. Viewing different metrics in the trends block
Each selected widget provides unique insights: total hours, average pay rate, and labour cost. By displaying data over the past five weeks, these metrics help you assess rostering’s impact on your budget.
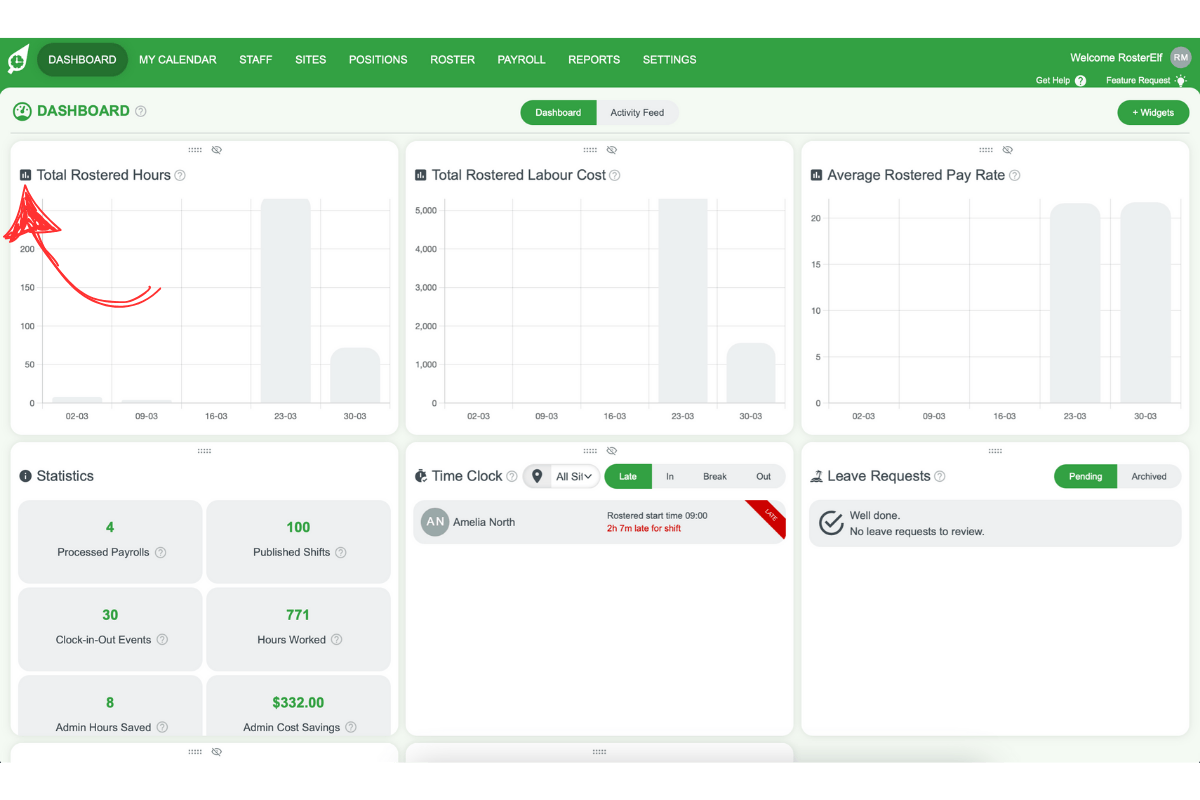
2.1 hours overview
2.1.1 View weekly hours across all sites.
2.1.2 Monitor hours trends across the past five weeks.
2.1.3 Use this view to gauge weekly consistency in rostering.
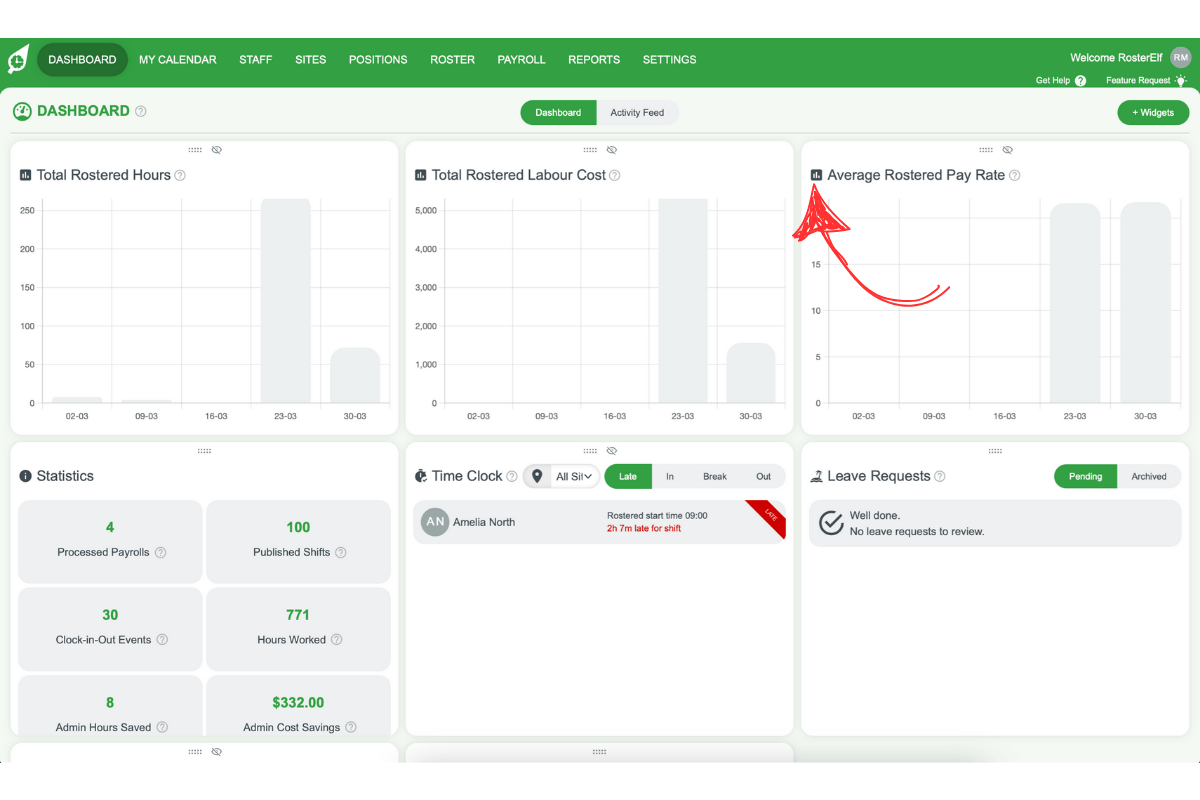
2.2 average pay-rate insight
2.2.1 Review hourly pay averages across locations.
2.2.2 Watch for pay rate increases to manage hiring needs.
2.2.3 Adjust rosters if the rate rises, aiming for a balanced staff mix.
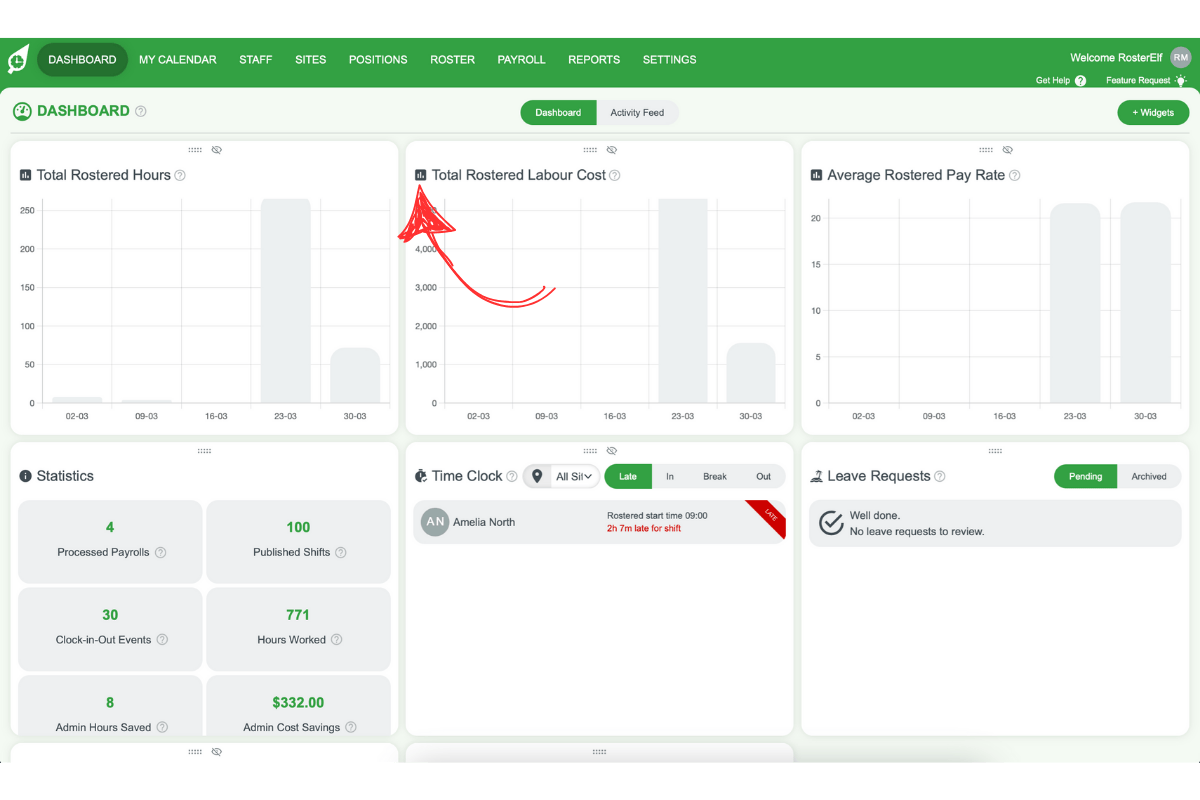
2.3 labour cost estimate
2.3.1 Check labour cost estimates over five weeks.
2.3.2 Ensure pay rate data is current for accuracy.
2.3.3 Use this view to identify budget impact from pay rate and award rules.
Frequently asked questions
1. How can I access different trends metrics on the dashboard?
To access different metrics in the trends block, click the + Widget button in the top right corner of the dashboard. Then, select Roster (Hours), Roster (Labour Cost), and Roster (Avg Pay Rate).
2. What does the hours overview in the trends block show?
The hours overview displays the total rostered hours across all sites for the past five weeks, providing a trend view of weekly hours to help you monitor rostering consistency.
3. How does the average pay rate metric help manage budgets?
The average pay rate metric shows the average hourly cost for employees, giving insight into wage trends. If you see a rising pay rate, it may signal the need to balance staff levels or adjust the roster for optimal budget control.
4. Why is it important to keep pay rate data updated for labour cost estimates?
Labour cost estimates in the trends block combine pay rate data with award interpretations. Keeping pay rate data current ensures the labour cost view accurately reflects workforce expenses and supports precise budgeting.
5. How does the trends block help with roster budget adjustments?
The trends block provides a five-week history of hours, pay rates, and labour costs, allowing managers to assess trends and make data-driven adjustments to roster spending. It is a valuable tool for tracking workforce costs and ensuring budget alignment.